Report
Campaigns in Maryland: What Does It Take to Win?

From 2011–2014, senators received an average of $290,070 in contributions
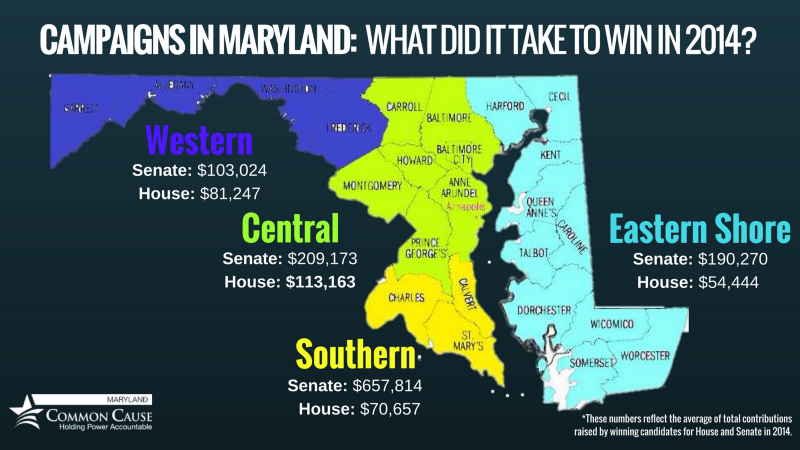
With candidates already gearing up for the 2018 elections, Common Cause Maryland released an analysis today of legislative candidates’ fundraising totals from the 2014 election cycle. The data helps document how fundraising expectations for candidates are rising across the state.
From 2011–2014, senators received an average of $290,070 in contributions, compared to a $79,878 average for delegates.
“Interestingly enough, the data showed no universal trend,” said Susan Radov, Summer Research Associate for Common Cause Maryland and author of the report. “Geographical location greatly influenced the average amounts raised by candidates; however, the competitiveness of a seat as well as a candidate’s leadership position and political aspirations greatly impacted candidates’ fundraising efforts.”
Fundraising by individual candidates certainly drove up the averages. Fifteen successful Senate candidates each raised over $250,000; 11 broke $300,000 and seven raised over $400,000. In the House, 28 candidates raised over $150,000, 14 broke $200,000, and two raised more than $300,000.
“This report is just one way of analyzing what it costs to run in our state legislative races,” said Jennifer Bevan-Dangel, executive director of Common Cause Maryland. “This report did not analyze what candidates ultimately spent on their races — or what funds they transferred to other candidates, slates, or campaign accounts. Likewise, this report did not analyze spending by independent groups or PACs, which are a rising factor in state campaigns. But these fundraising numbers provide a snapshot of what candidates face when they are running for office. And the rising costs serve as a warning.”
“We must explore new ways to fund our elections, such as citizen funded election programs,” Bevan-Dangel added. “These programs, like the one operational in Montgomery County for 2018 and recently passed in Howard County, ensure that good candidates are not left out of our elections because they do not have the access to the big donors they need to compete.”
Radov produced the report by using the state’s campaign finance database to gather each winning candidate’s total contributions from January 2011 through December 2014. She then averaged the contribution totals by region, county, and district. Radov only included districts that spanned multiple counties in the average for the county that comprised the majority of the district.

