
博客文章
DRA Analysis of NCGA Member Submitted Maps
In order to further public transparency this redistricting cycle and allow for public review of potential draft maps that will be up for consideration, Common Cause has uploaded the member-submitted maps posted on the NCleg.gov website into Dave’s Redistricting Application (DRA). This information is provided for public education only, and the analysis here reflects that generated by the DRA program and does not constitute an opinion on or endorsement of these maps by Common Cause.
Click on map name to jump to its analysis section:
Draft Congressional Maps:
CST-13 Draft NC Congressional Map (Drawn by Senate Redistricting Co-Chairs)
CMT-9 Draft NC Congressional Map (Drawn by Senate Redistricting Co-Chairs)
CBK-3 Draft NC Congressional Map (Drawn by Senate Redistricting Co-Chairs)
CCH-8 Draft NC Congressional Map (Unofficial DRA-Trace, Drawn by Senate Redistricting Co-Chairs)
CST-2 Draft NC Congressional Map (Drawn by Senate Redistricting Co-Chairs)
CBK-4 Draft US Congressional Map (Drawn by Sen. Ben Clark)
CBK-5 Draft NC Congressional Map (Drawn by Sen. Ben Clark)
CST-10 Draft NC Congressional Map (Drawn by Sen. Ben Clark)
CST-6 Draft NC Congressional Map (Drawn by Sen. Jay Chaudhuri)
CST-8 Draft NC Congressional Map
Draft NC Senate maps:
SST-13 Draft NC Senate Map (Drawn by Senate Redistricting Co-Chairs)
SCH-3 Draft NC Senate Map (Unofficial, DRA Trace, Drawn by Senate Redistricting Co-Chairs)
SST-4 Draft NC Senate Map (Drawn by Senate Redistricting Co-Chairs)
Draft NC House maps:
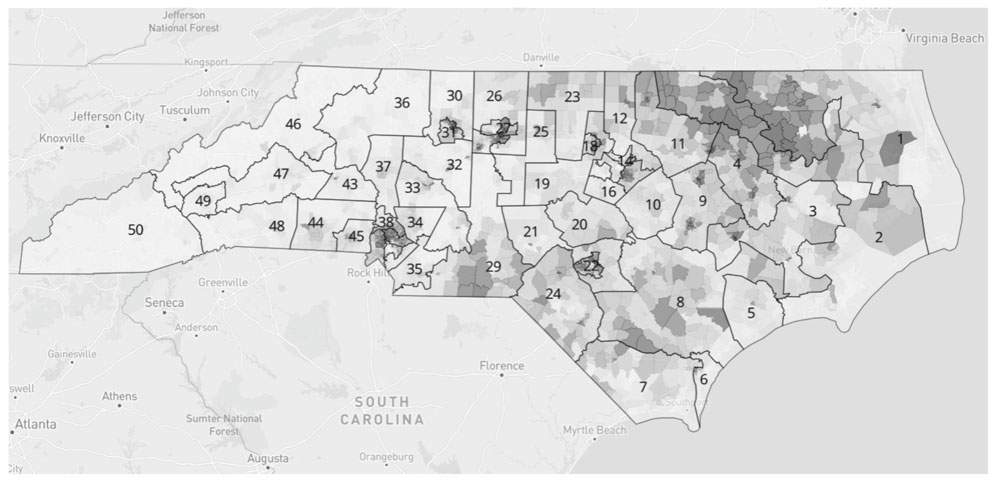
HBK-11 Draft NC House Map (Drawn by Rep. Destin Hall, chair of the House Redistricting Committee)
Draft NC Congressional Maps
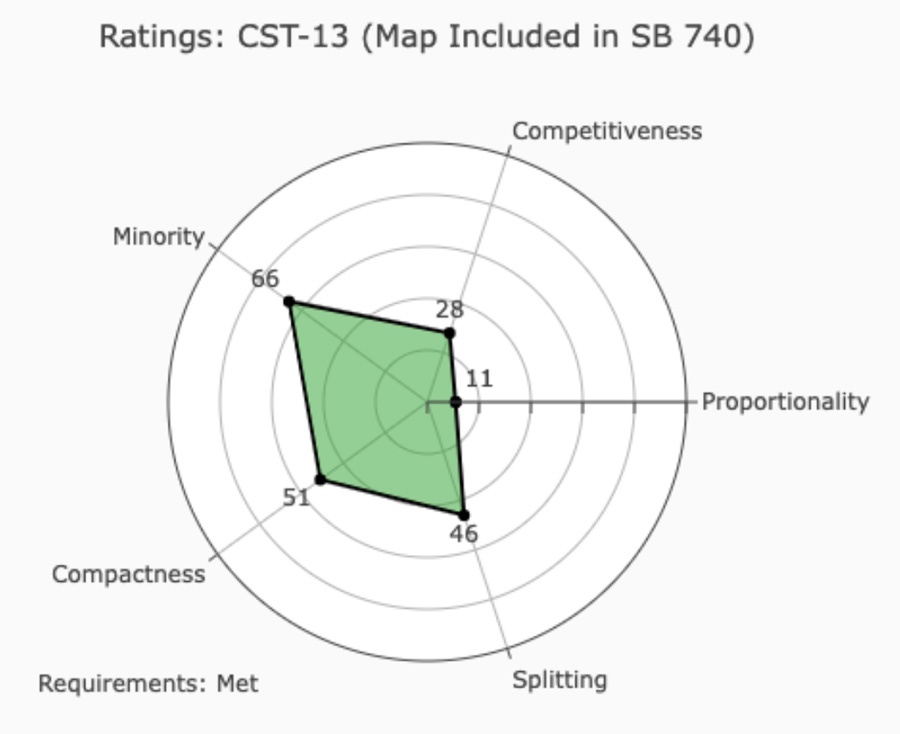
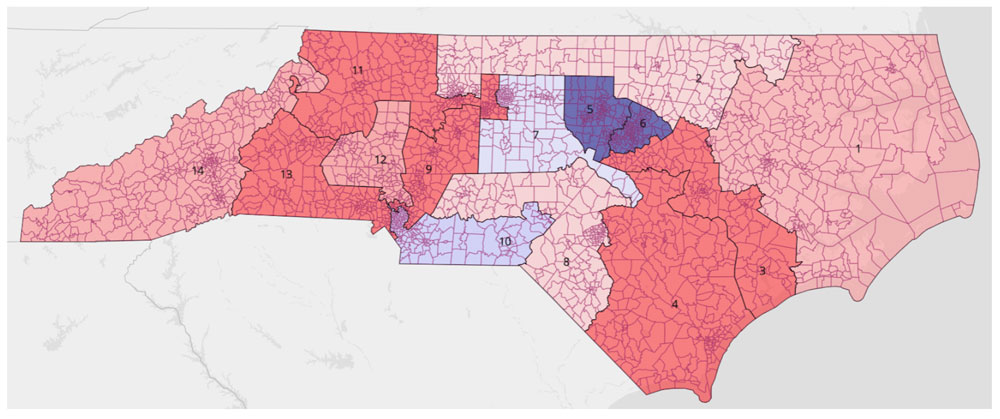
CST-13 Draft NC Congressional Map (Drawn by Senate Redistricting Co-Chairs)

This map was amended from CCH-8 which was amended from CBK-3. It has been included in the bill, SB 740.
The DRA Analysis shows:
- 8 districts are likely Republican
- Districts: 1, 3, 7, 8, 10, 11, 12, and 13
- 3 districts are likely Democratic
- Districts: 5, 6, and 9
- 3 districts are competitive.
- Districts: 2, 4, and 14
- There is 1 majority-minority district.
- District 9
DRA Analytics:
DRA 检查地图如何满足 5 个不同的标准: 比例, 竞争力, 少数族裔代表, 紧凑, 和 分裂。其每个类别的得分按 0-100 的等级列出如下。数字越高,得分越高。请注意,DRA 的少数族裔代表分析并不能确保遵守《投票权法案》(VRA)。DRA 还指出,利益共同体等某些因素可能难以量化。
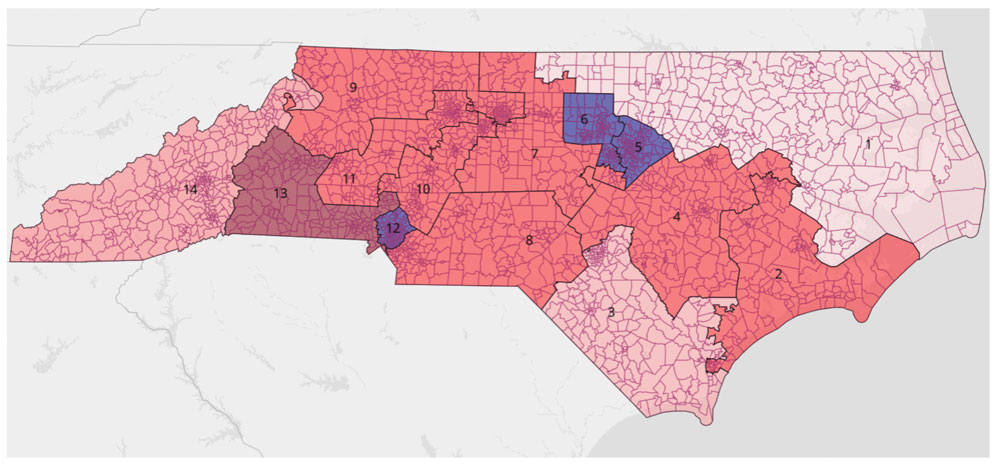
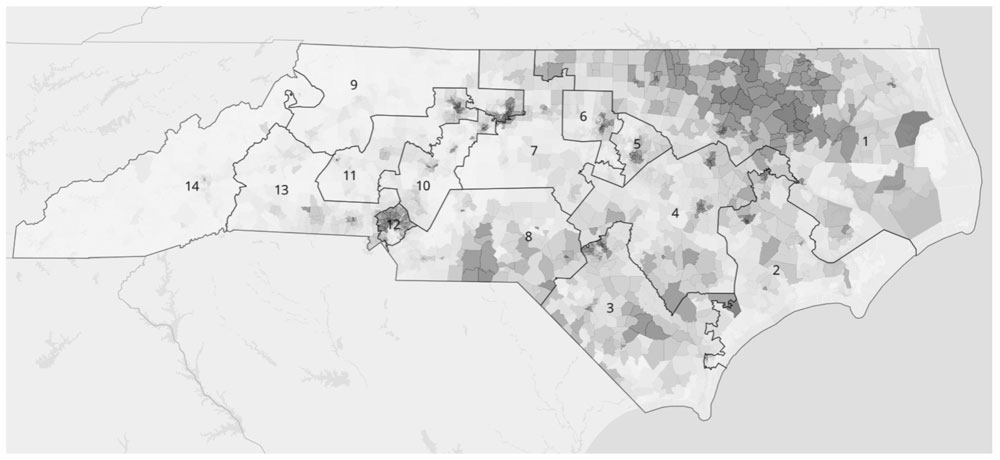
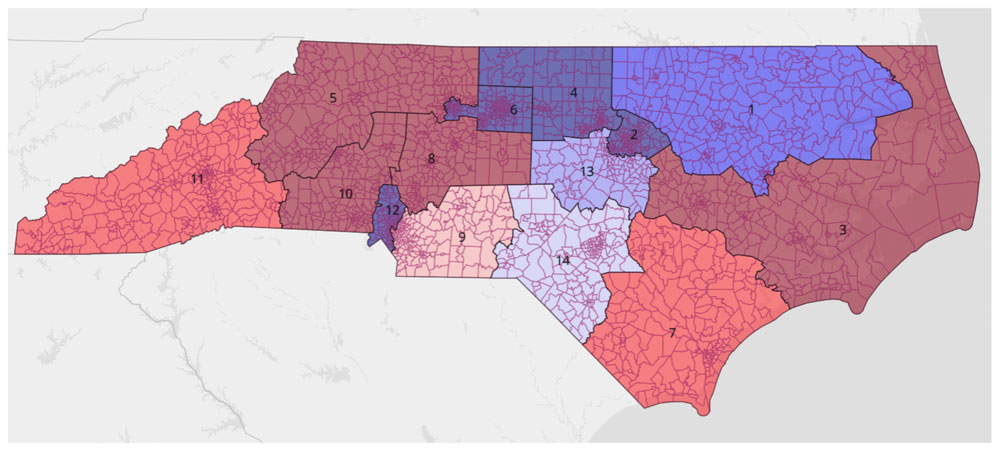
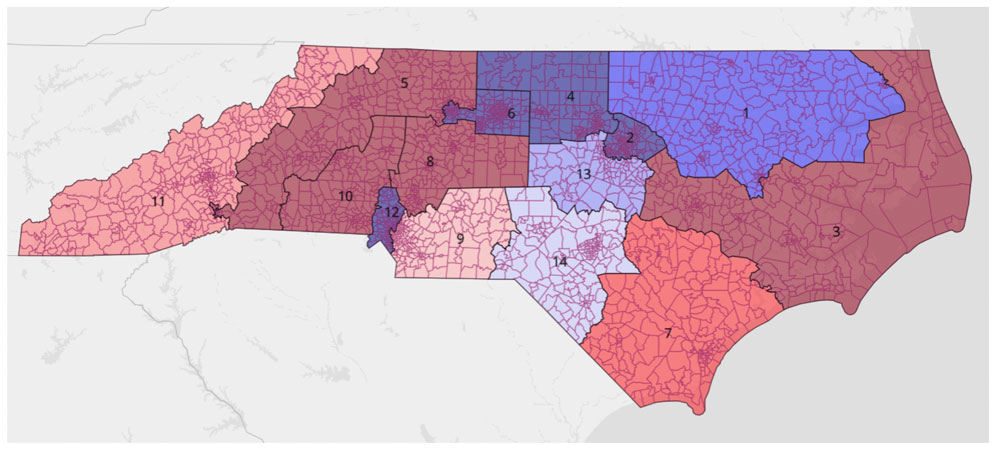
Below is a view of the draft congressional map based on composite 2016-2020 election data 它综合了几次选举的结果。红色或蓝色越深,席位越安全。颜色越浅,席位越不安全。
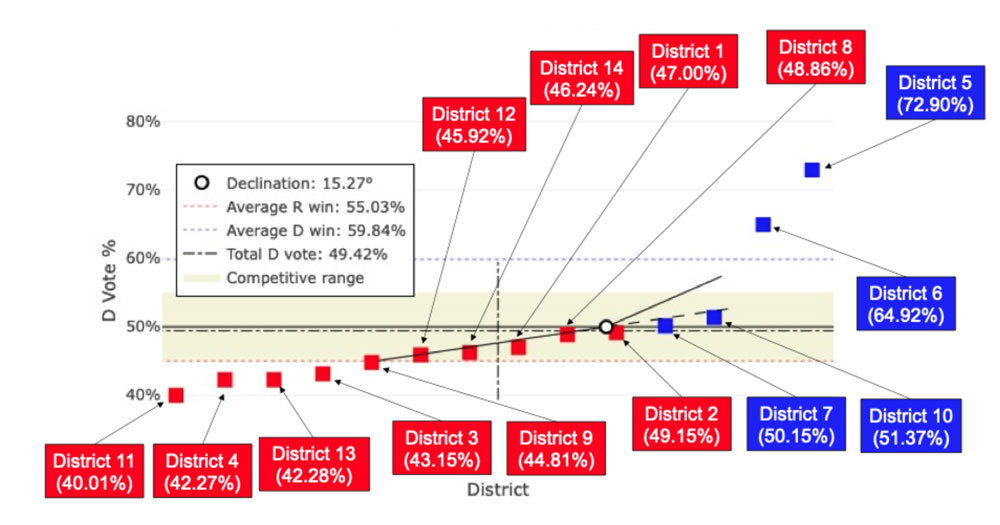
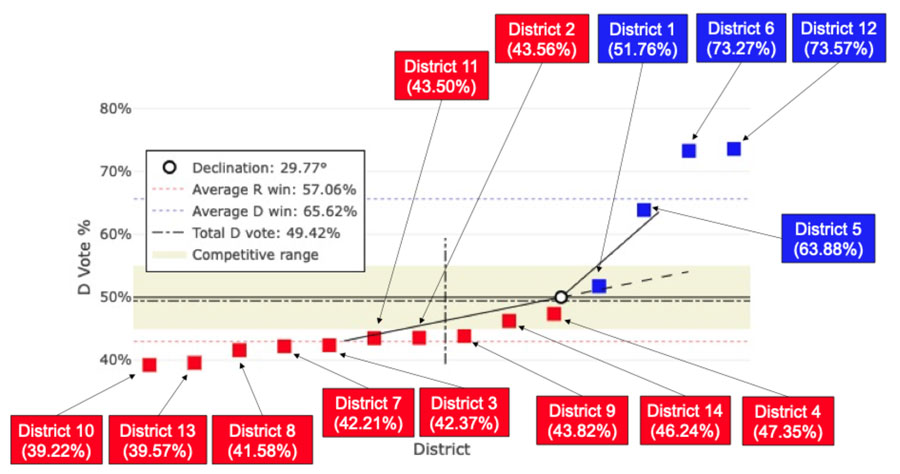
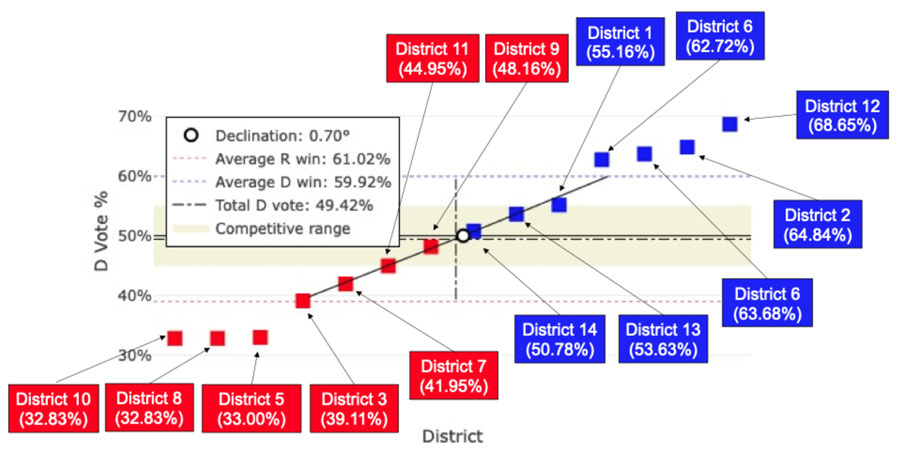
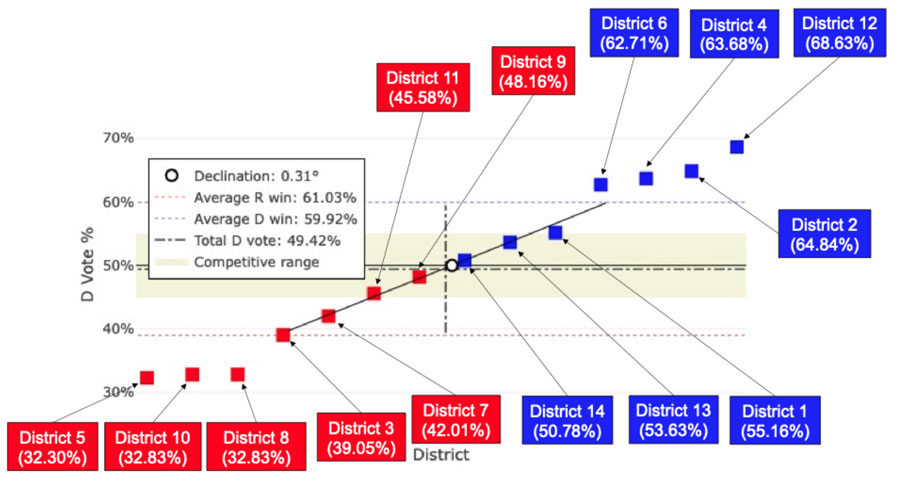
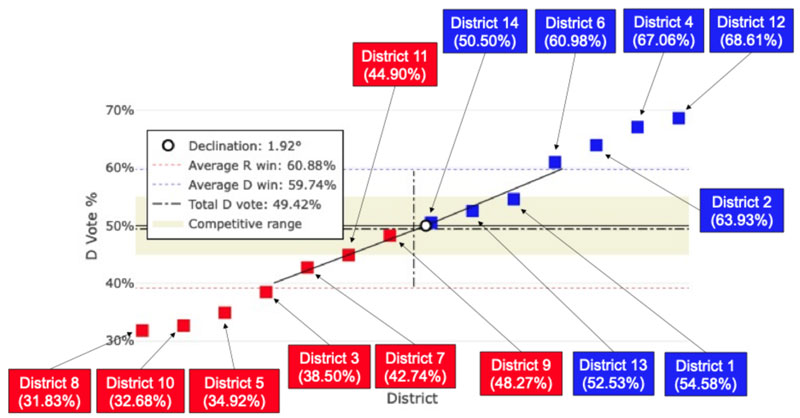
To measure competitiveness, DRA uses the Democratic vote share. The rank votes graph below illustrates the Democratic vote share in each district. Three of the districts had a Democratic vote share between 45% and 55% which DRA considers competitive. This includes districts 2, 4 and 14. To learn more about how the rank votes graph works, 点击这里.

According to the DRA analysis, the most likely outcome of this map would be a 10-4 split in favor of the Republicans. If Democrats won all the competitive districts, the result could be a 8-6 split in favor of the Republicans. If Republicans won all the competitive districts, the result could be a 11-3 split in favor of the Republicans.
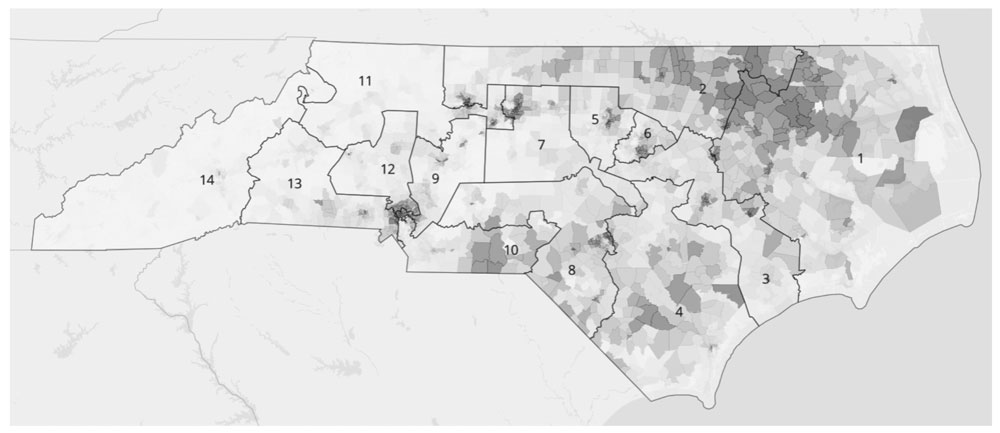
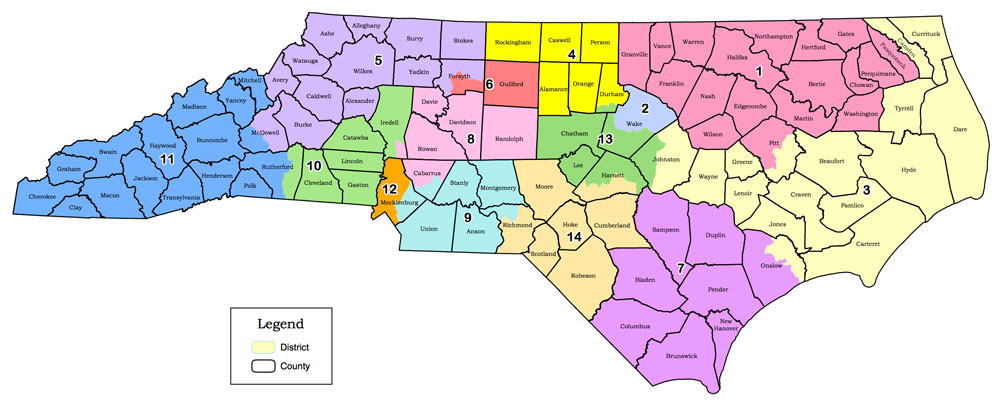
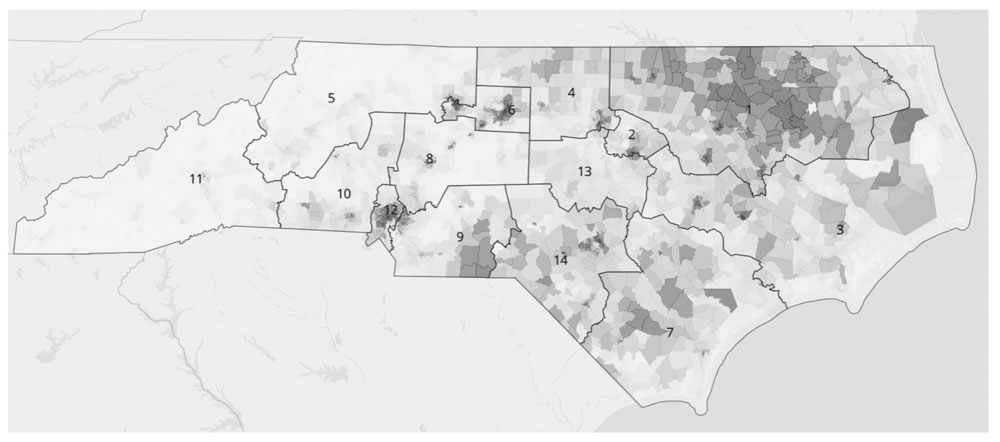
这张地图显示了北卡罗来纳州黑人人口在各个地区的分布情况:

Two of the districts have a Black voting age population (BVAP) of 37% or higher. This includes district 2 (39.99% BVAP) and district 9 (37.95% BVAP).
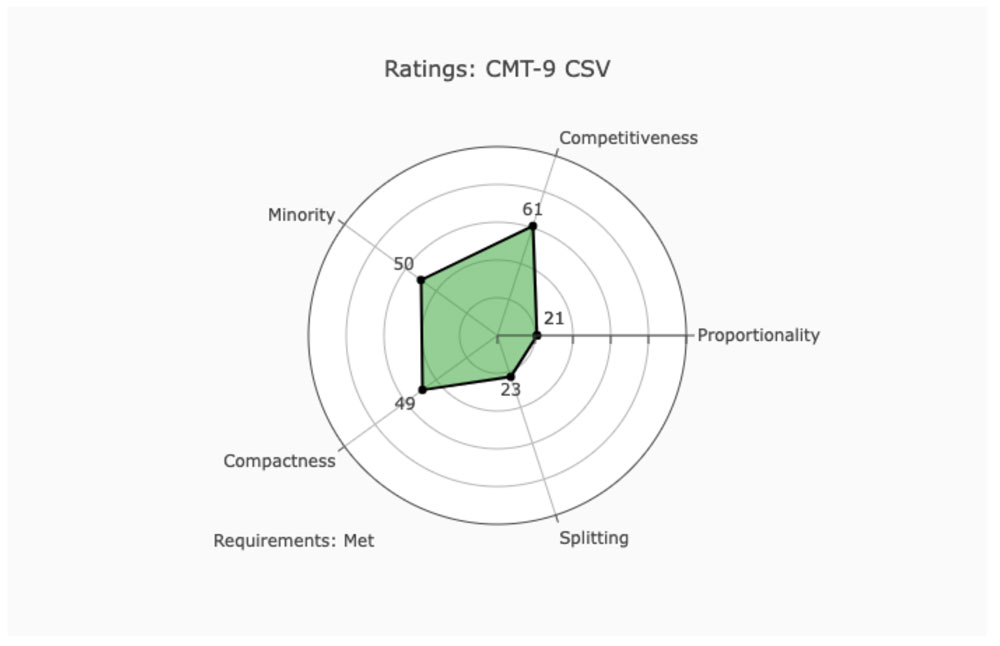
CMT-9 Draft NC Congressional Map (Drawn by Senate Redistricting Co-Chairs)
The DRA Analysis shows:
- 5 districts are likely Republican
- Districts: 3, 4, 9, 11, and 13
- 2 districts are likely Democratic
- Districts: 5 and 6
- 7 districts are competitive.
- Districts: 1, 2, 7, 8, 10, 12, and 14
- There is 1 majority-minority district.
- District 8
DRA Analytics:
DRA 检查地图如何满足 5 个不同的标准: 比例, 竞争力, 少数族裔代表, 紧凑, 和 分裂。其每个类别的得分按 0-100 的等级列出如下。数字越高,得分越高。请注意,DRA 的少数族裔代表分析并不能确保遵守《投票权法案》(VRA)。DRA 还指出,利益共同体等某些因素可能难以量化。
Below is a view of the draft congressional map based on composite 2016-2020 election data 它综合了几次选举的结果。红色或蓝色越深,席位越安全。颜色越浅,席位越不安全。
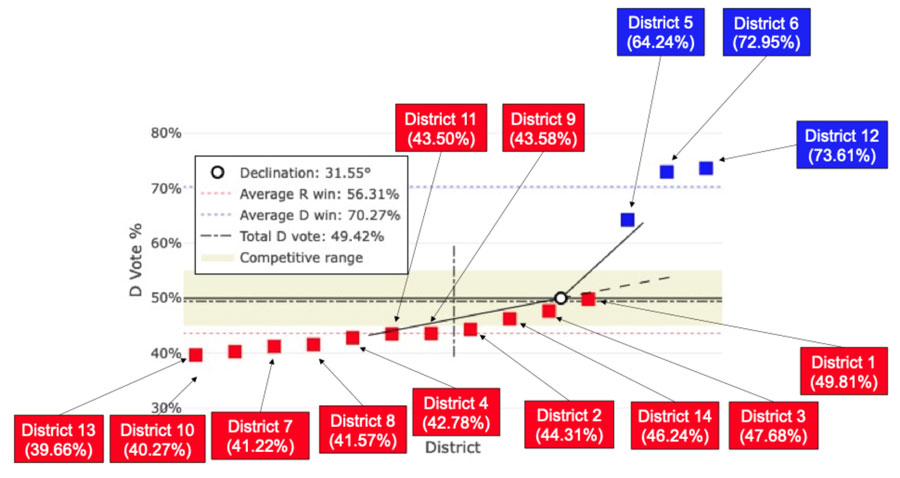
To measure competitiveness, DRA uses the Democratic vote share. The rank votes graph below illustrates the democratic vote share in each district. Seven of the districts had a Democratic vote share between 45% and 55% which DRA considers competitive. This includes districts 1, 2, 7, 8, 10, 12, 14. However, out of these 7 districts, 5 of them (all except districts 7 and 10) had a Democratic vote share between 45% and 50%. To learn more about how the rank votes graph works, 点击这里.
According to the DRA analysis, the most likely outcome of this map would be a 10-4 split in favor of the Republicans. If Democrats won all the competitive districts, the result could be a 9-5 split in favor of the Democrats. If Republicans won all the competitive districts, the result could be a 12-2 split in favor of the Republicans.
这张地图显示了北卡罗来纳州黑人人口在各个地区的分布情况:
None of the districts have a Black voting age population of 37% or higher.
CBK-3 Draft NC Congressional Map (Drawn by Senate Redistricting Co-Chairs)

The DRA Analysis shows:
- 8 districts are likely Republican
- Districts: 2, 3, 7, 8, 9, 10, 11, and 13
- 3 districts are likely Democratic
- Districts: 5, 6, and 12
- 3 districts are competitive.
- Districts: 1, 4, and 14
- There is 1 majority-minority district.
- District 12
DRA Analytics:
DRA 检查地图如何满足 5 个不同的标准: 比例, 竞争力, 少数族裔代表, 紧凑, 和 分裂。其每个类别的得分按 0-100 的等级列出如下。数字越高,得分越高。请注意,DRA 的少数族裔代表分析并不能确保遵守《投票权法案》(VRA)。DRA 还指出,利益共同体等某些因素可能难以量化。
Below is a view of the draft congressional map based on composite 2016-2020 election data 它综合了几次选举的结果。红色或蓝色越深,席位越安全。颜色越浅,席位越不安全。

To measure competitiveness, DRA uses the Democratic vote share. The rank votes graph below illustrates the democratic vote share in each district. Three of the districts had a Democratic vote share between 45% and 55% which DRA considers competitive. This includes districts 1, 4 and 14. To learn more about how the rank votes graph works, 点击这里.
According to the DRA analysis, the most likely outcome of this map would be a 10-4 split in favor of the Republicans. If Democrats won all the competitive districts, the result could be a 8-6 split in favor of the Republicans. If Republicans won all the competitive districts, the result could be a 11-3 split in favor of the Republicans.
这张地图显示了北卡罗来纳州黑人人口在各个地区的分布情况:
Two of the districts have a Black voting age population (BVAP) of 37% or higher. This includes district 1 (38.87% BVAP) and district 12 (38.01%).
CCH-8 Draft NC Congressional Map (Unofficial DRA-Trace, Drawn by Senate Redistricting Co-Chairs)
This map was amended from CBK-3. It was drawn by the Senate redistricting co-chairs on October 26 and October 27. It has not yet been posted to ncleg.gov.
The DRA Analysis shows:
- 8 districts are likely Republican
- Districts: 2, 3, 7, 8, 9, 10, 11, and 13
- 3 districts are likely Democratic
- Districts: 5, 6, and 12
- 3 districts are competitive.
- Districts: 1, 4, and 14
- There is 1 majority-minority district.
- District 12
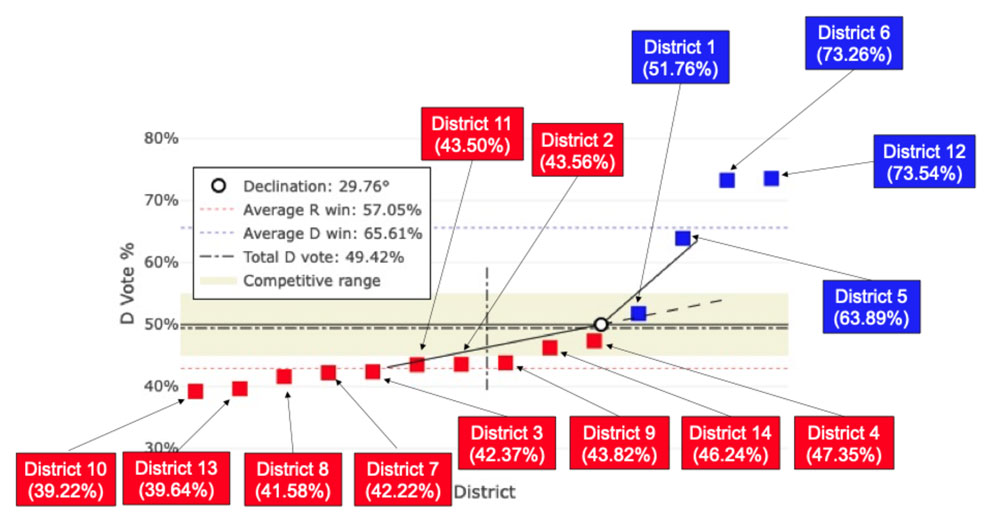
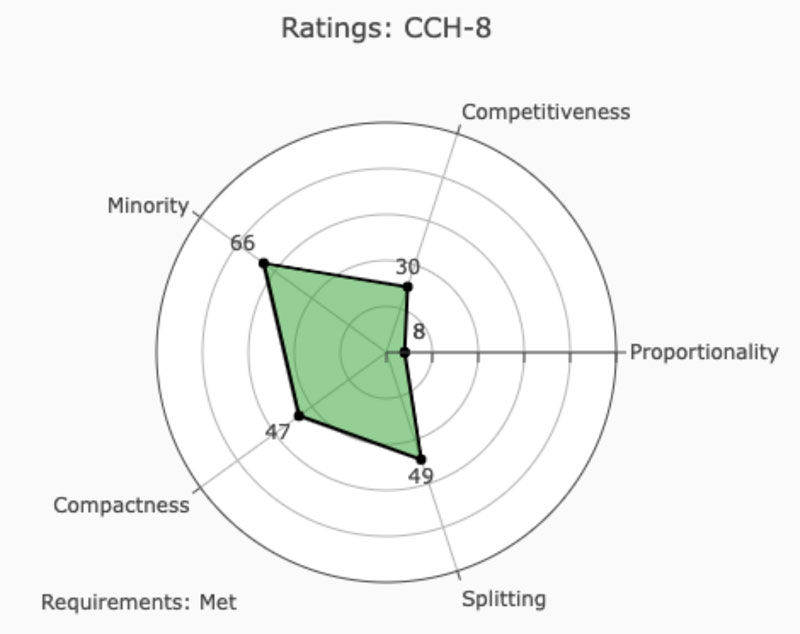
DRA Analytics:DRA examines how the map addresses 5 different criteria: 比例, 竞争力, 少数族裔代表, 紧凑, 和 分裂。其每个类别的得分按 0-100 的等级列出如下。数字越高,得分越高。请注意,DRA 的少数族裔代表分析并不能确保遵守《投票权法案》(VRA)。DRA 还指出,利益共同体等某些因素可能难以量化。
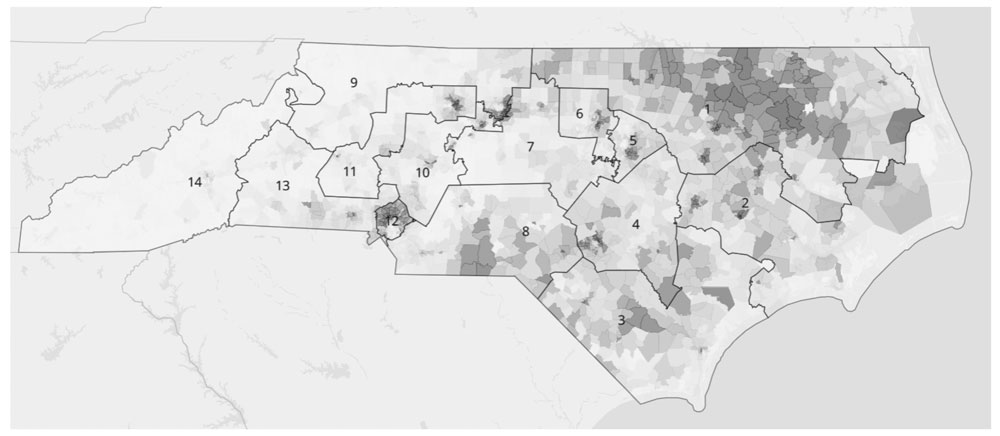
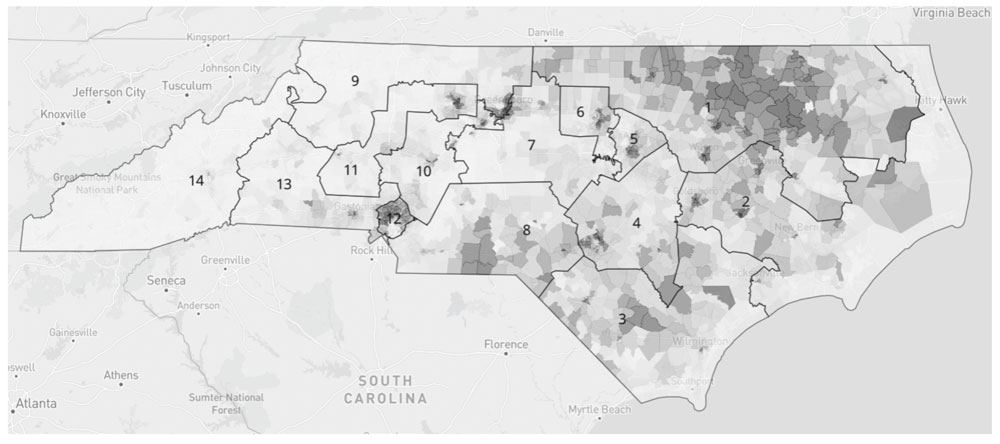
Below is a view of the draft congressional map based on composite 2016-2020 election data 它综合了几次选举的结果。红色或蓝色越深,席位越安全。颜色越浅,席位越不安全。
To measure competitiveness, DRA uses the Democratic vote share. The rank votes graph below illustrates the democratic vote share in each district. Three of the districts had a Democratic vote share between 45% and 55% which DRA considers competitive. This includes districts 1, 4 and 14. To learn more about how the rank votes graph works, 点击这里.
According to the DRA analysis, the most likely outcome of this map would be a 10-4 split in favor of the Republicans. If Democrats won all the competitive districts, the result could be a 8-6 split in favor of the Republicans. If Republicans won all the competitive districts, the result could be a 11-3 split in favor of the Republicans.
这张地图显示了北卡罗来纳州黑人人口在各个地区的分布情况:

Two of the districts have a Black voting age population (BVAP) of 37% or higher. This includes district 1 (38.87% BVAP) and district 12 (37.95% BVAP).
CST-2 Draft NC Congressional Map (Drawn by Senate Redistricting Co-Chairs)

The DRA Analysis shows:
- 8 districts are likely Republican
- Districts: 2, 4, 7, 8, 9, 10, 11, and 13
- 3 districts are likely Democratic
- Districts: 5, 6, and 12
- 3 districts are competitive.
- Districts: 1, 3, and 14
- There is 1 majority-minority district.
- District 12
DRA Analytics:
DRA 检查地图如何满足 5 个不同的标准: 比例, 竞争力, 少数族裔代表, 紧凑, 和 分裂。其每个类别的得分按 0-100 的等级列出如下。数字越高,得分越高。请注意,DRA 的少数族裔代表分析并不能确保遵守《投票权法案》(VRA)。DRA 还指出,利益共同体等某些因素可能难以量化。
Below is a view of the draft congressional map based on composite 2016-2020 election data 它综合了几次选举的结果。红色或蓝色越深,席位越安全。颜色越浅,席位越不安全。
To measure competitiveness, DRA uses the Democratic vote share. The rank votes graph below illustrates the democratic vote share in each district. Three of the districts had Democratic vote share between 45% and 55% which DRA considers competitive. This includes districts 1, 3 and 14. To learn more about how the rank votes graph works, 点击这里.
According to the DRA analysis, the most likely outcome of this map would be an 11-3 split in favor of the Republicans. If Democrats won all the competitive districts, the result could be an 8-6 split in favor of the Republicans. If Republicans won all of the competitive districts, the result would be an 11-3 split in favor of the Republicans.
这张地图显示了北卡罗来纳州黑人人口在各个地区的分布情况:
District 12 has a Black voting age population of 38%. It is the only district with a Black voting age population over 37%. It is also the only majority-minority district.
CBK-4 Draft US Congressional Map (Drawn by Sen. Ben Clark)
The DRA Analysis shows:
- 6 districts are likely Republican
- Districts: 3, 5, 7, 8, 10, and 11.
- 5 districts are likely Democratic
- Districts: 1, 2, 4, 6, and 12
- 3 districts are competitive.
- Districts: 9, 13, and 14
- There are 3 majority-minority districts.
- Districts: 1, 12, and 14
DRA Analytics:
DRA 检查地图如何满足 5 个不同的标准: 比例, 竞争力, 少数族裔代表, 紧凑, 和 分裂。其每个类别的得分按 0-100 的等级列出如下。数字越高,得分越高。请注意,DRA 的少数族裔代表分析并不能确保遵守《投票权法案》(VRA)。DRA 还指出,利益共同体等某些因素可能难以量化。

Below is a view of the draft congressional map based on composite 2016-2020 election data 它综合了几次选举的结果。红色或蓝色越深,席位越安全。颜色越浅,席位越不安全。
To measure competitiveness, DRA uses the Democratic vote share. The rank votes graph below illustrates the democratic vote share in each district. Three of the districts had a Democratic vote share between 45% and 55% which DRA considers competitive. This includes districts 9, 13, and 14. Two districts fall just outside of the competitive range: district 1 at 55.16% Democratic vote share and district 11 at 44.95% democratic vote share. To learn more about how the rank votes graph works, 点击这里.
According to the DRA analysis, the most likely outcome of this map would be a 7-7 split with seven districts electing a Democrat and seven electing a Republican. If Democrats won all of the competitive districts the result could be an 8-6 split favoring the Democrats. If Republicans won all of the competitive districts the result could be a 9-5 split favoring the Republicans.
这张地图显示了北卡罗来纳州黑人人口在各个地区的分布情况:
District 1 has a Black voting age population of 41.55%. None of the other districts have a Black voting age population above 37%.
CBK-5 Draft NC Congressional Map (Drawn by Sen. Ben Clark)

The DRA Analysis shows:
- 5 districts are likely Republican
- Districts: 3, 5, 7, 8, and 10
- 5 districts are likely Democratic
- Districts: 1, 2, 4, 6, and 12
- 4 districts are competitive.
- Districts: 9, 11, 13, and 14
- There are 3 majority-minority districts.
- Districts: 1, 12, and 14
DRA Analytics:
DRA 检查地图如何满足 5 个不同的标准: 比例, 竞争力, 少数族裔代表, 紧凑, 和 分裂. Its scores for each category are listed below on a 0-100 scale. A higher number indicates a better score. Note that DRA’s Minority Representation analysis does not ensure Voting Rights Act (VRA) compliance. DRA also notes that some factors like communities of interest can be hard to quantify.
Below is a view of the draft congressional map based on composite 2016-2020 election data 它综合了几次选举的结果。红色或蓝色越深,席位越安全。颜色越浅,席位越不安全。
To measure competitiveness, DRA uses the Democratic vote share. The rank votes graph below illustrates the democratic vote share in each district. Four of the districts had a Democratic vote share between 45% and 55% which DRA considers competitive. This includes districts 9, 11, 13, and 14. District 1 falls just outside of the range with a Democratic vote share of 55.16%. To learn more about how the rank votes graph works, 点击这里.
According to the DRA analysis, the most likely outcome of this map would be a 7-7 split with seven districts electing a Democrat and seven electing a Republican. If Democrats won all of the competitive districts, the result could be a 9-5 split favoring the Democrats. If the Republicans won all the competitive districts, the result could be a 9-5 split in favor of the Republicans.
这张地图显示了北卡罗来纳州黑人人口在各个地区的分布情况:
District 1 has a Black voting age population of 41.55%. It is the only district with a Black Voting Age population of over 37%.
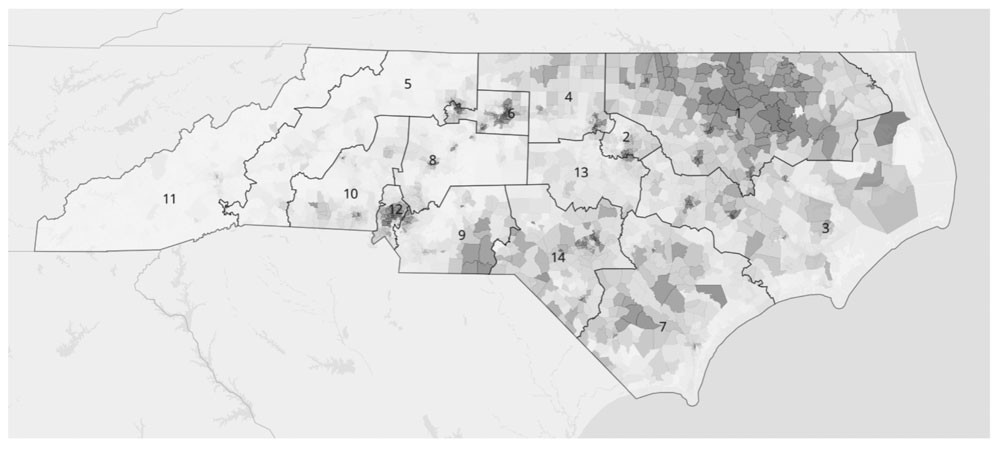
CST-10 Draft NC Congressional Map (Drawn by Sen. Ben Clark)

The DRA Analysis shows:
- 5 districts are likely Republican
- Districts: 3, 5, 7, 8, and 10
- 4 districts are likely Democratic
- Districts: 2, 4, 6, and 12
- 5 districts are competitive.
- Districts: 1, 9, 11, 13 and 14
- There are 3 majority-minority districts.
- District 1, 12, and 14
DRA Analytics:
DRA 检查地图如何满足 5 个不同的标准: 比例, 竞争力, 少数族裔代表, 紧凑, 和 分裂。其每个类别的得分按 0-100 的等级列出如下。数字越高,得分越高。请注意,DRA 的少数族裔代表分析并不能确保遵守《投票权法案》(VRA)。DRA 还指出,利益共同体等某些因素可能难以量化。
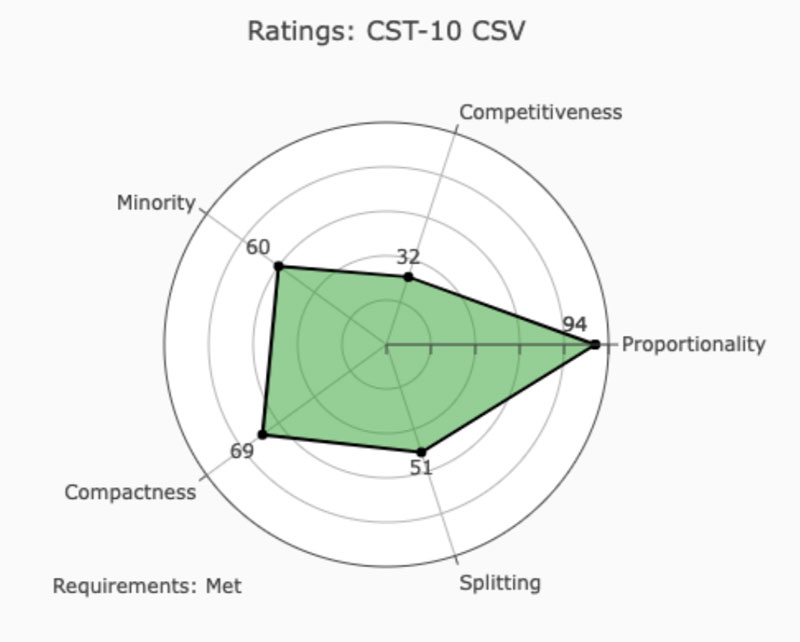
Below is a view of the draft congressional map based on composite 2016-2020 election data 它综合了几次选举的结果。红色或蓝色越深,席位越安全。颜色越浅,席位越不安全。
To measure competitiveness, DRA uses the Democratic vote share. The rank votes graph below illustrates the democratic vote share in each district. Five of the districts had a Democratic vote share between 45% and 55% which DRA considers competitive. This includes districts 1, 9, 11, 13, and 14. To learn more about how the rank votes graph works, 点击这里.

According to the DRA analysis, the most likely outcome of this map would be a 7-7 split, 7 Democrats, 7 Republicans. If Democrats won all the competitive districts, the result could be a 9-5 split in favor of the Democrats. If Republicans won all the competitive districts, the result could be a 10-4 split in favor of the Republicans.
这张地图显示了北卡罗来纳州黑人人口在各个地区的分布情况:

District 1 has a Black voting age population of 41.89%. It is the only district with a Black voting age population over 37%.
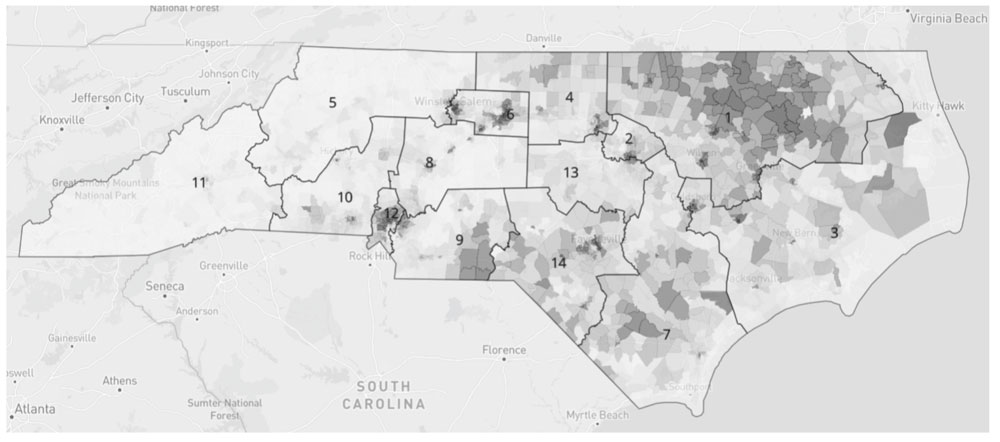
CST-6 Draft NC Congressional Map (Drawn by Sen. Jay Chaudhuri)

The DRA Analysis shows:
- 6 districts are likely Republican
- Districts: 3, 5, 7, 8, 10, and 11
- 4 districts are likely Democratic
- Districts: 2, 4, 6, and 12
- 4 districts are competitive.
- Districts: 1, 9, 13, and 14
- There are 3 majority-minority districts.
- Districts: 1, 12, and 14
DRA Analytics:
DRA 检查地图如何满足 5 个不同的标准: 比例, 竞争力, 少数族裔代表, 紧凑, 和 分裂。其每个类别的得分按 0-100 的等级列出如下。数字越高,得分越高。请注意,DRA 的少数族裔代表分析并不能确保遵守《投票权法案》(VRA)。DRA 还指出,利益共同体等某些因素可能难以量化。
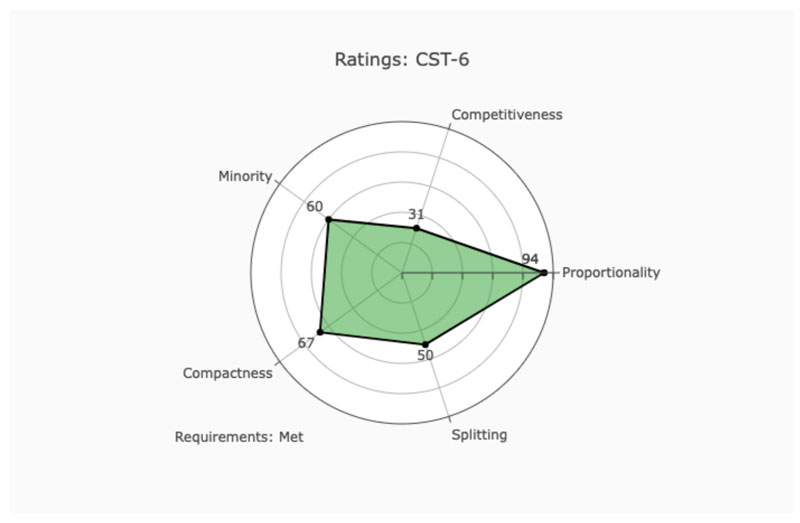
Below is a view of the draft congressional map based on composite 2016-2020 election data 它综合了几次选举的结果。红色或蓝色越深,席位越安全。颜色越浅,席位越不安全。
To measure competitiveness, DRA uses the Democratic vote share. The rank votes graph below illustrates the democratic vote share in each district. Four of the districts had a Democratic vote share between 45% and 55% which DRA considers competitive. This includes districts 1, 9, 13, and 14. To learn more about how the rank votes graph works, 点击这里.
According to the DRA analysis, the most likely outcome of this map would be a 7-7 split (7 Democrats, 7 Republicans). If Democrats won all the competitive districts, the result could be a 8-6 split in favor of the Democrats. If Republicans won all the competitive districts, the result could be a 10-4 split in favor of the Republicans.
这张地图显示了北卡罗来纳州黑人人口在各个地区的分布情况:
District 1 has a Black voting age population of 42.11%. It is the only district with a Black voting age population over 37%.
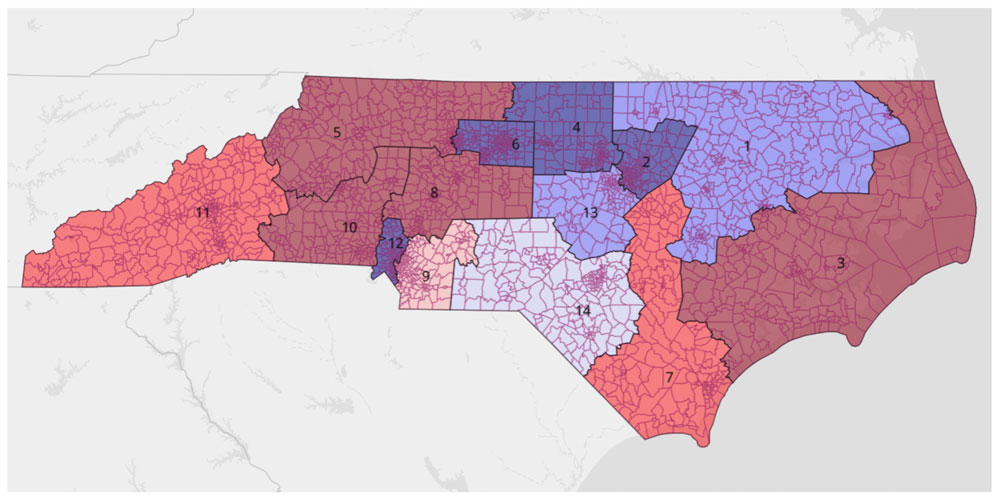
CBA-2 Draft NC Congressional Map (Drawn by Rep. Destin Hall, chair of the House Redistricting Committee)

The DRA Analysis shows:
- 8 districts are likely Republican
- Districts: 1, 2, 3, 4, 6, 7, 12, and 14
- 4 districts are likely Democratic
- Districts: 5, 8, 9, and 10
- 2 districts are competitive.
- Districts: 11 and 13
- There are 1 majority-minority district.
- District 5
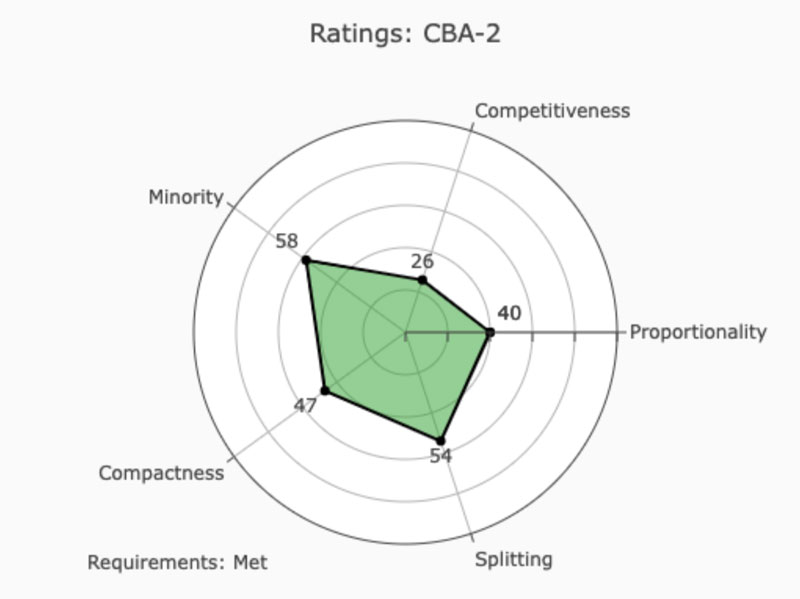
DRA Analytics:
DRA 检查地图如何满足 5 个不同的标准: 比例, 竞争力, 少数族裔代表, 紧凑, 和 分裂。其每个类别的得分按 0-100 的等级列出如下。数字越高,得分越高。请注意,DRA 的少数族裔代表分析并不能确保遵守《投票权法案》(VRA)。DRA 还指出,利益共同体等某些因素可能难以量化。
Below is a view of the draft congressional map based on composite 2016-2020 election data 它综合了几次选举的结果。红色或蓝色越深,席位越安全。颜色越浅,席位越不安全。

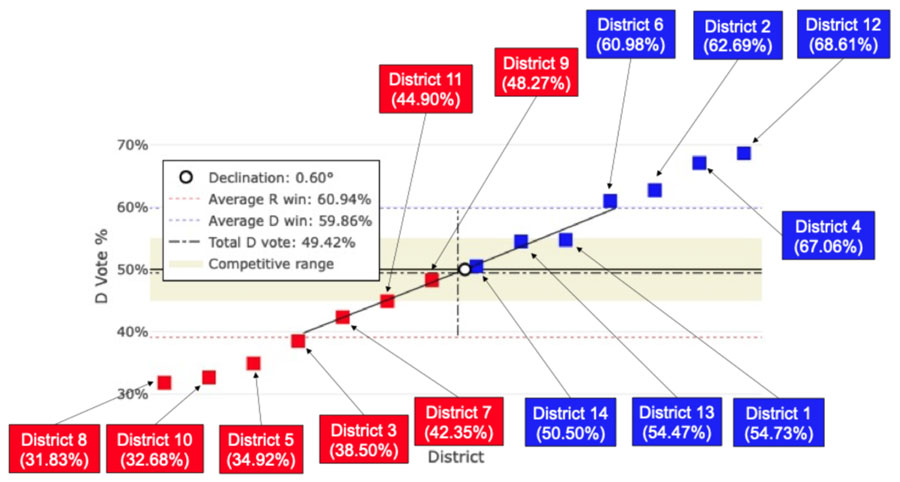
To measure competitiveness, DRA uses the Democratic vote share. The rank votes graph below illustrates the democratic vote share in each district. Two of the districts had a Democratic vote share between 45% and 55% which DRA considers competitive. This includes districts 11 and 13. To learn more about how the rank votes graph works, 点击这里.
According to the DRA analysis, the most likely outcome of this map would be a 7-7 split, 7 Democrats, 7 Republicans. If Democrats won all the competitive districts, the result could be a 8-6 split in favor of the Democrats. If Republicans won all the competitive districts, the result could be a 10-4 split in favor of the Republicans.
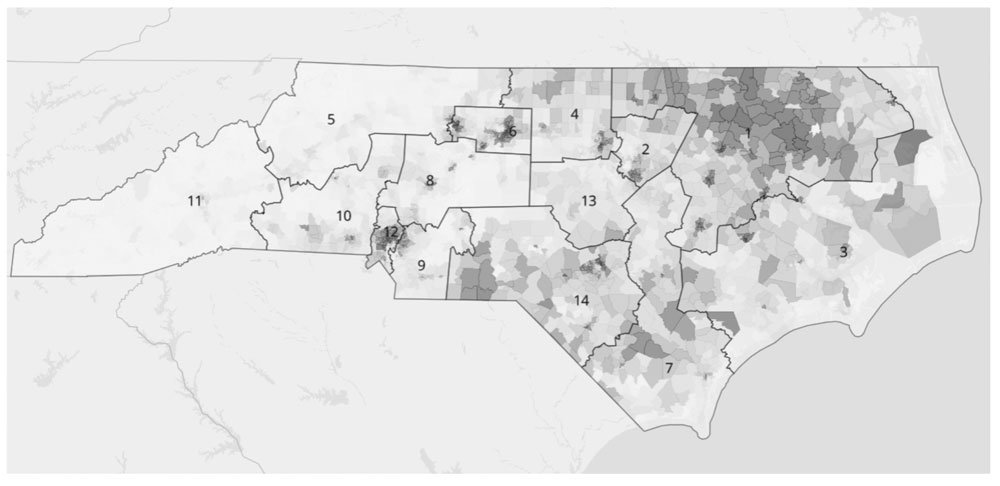
这张地图显示了北卡罗来纳州黑人人口在各个地区的分布情况:
District 11 has a Black voting age population of 38.7%. It is the only district with a Black voting age population over 37%.
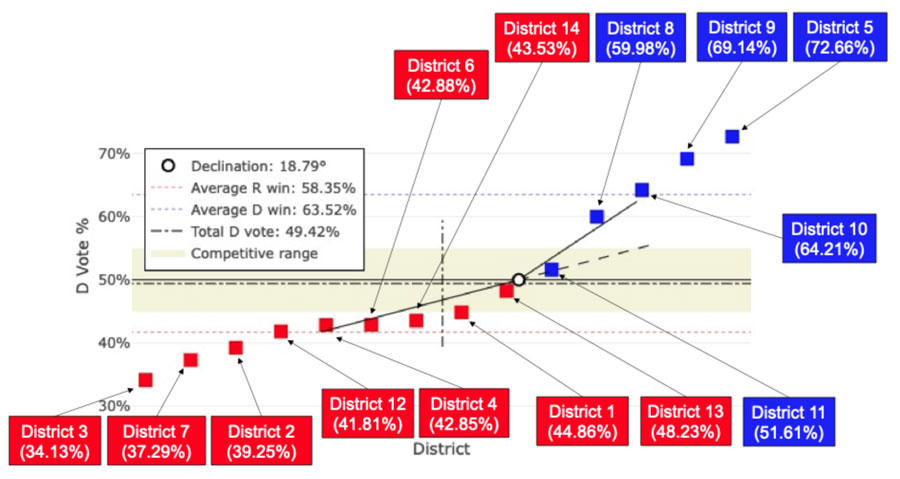
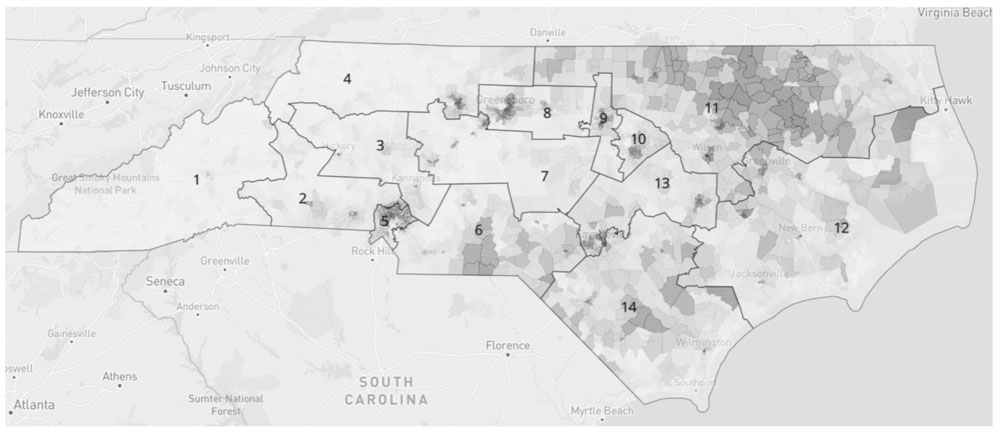
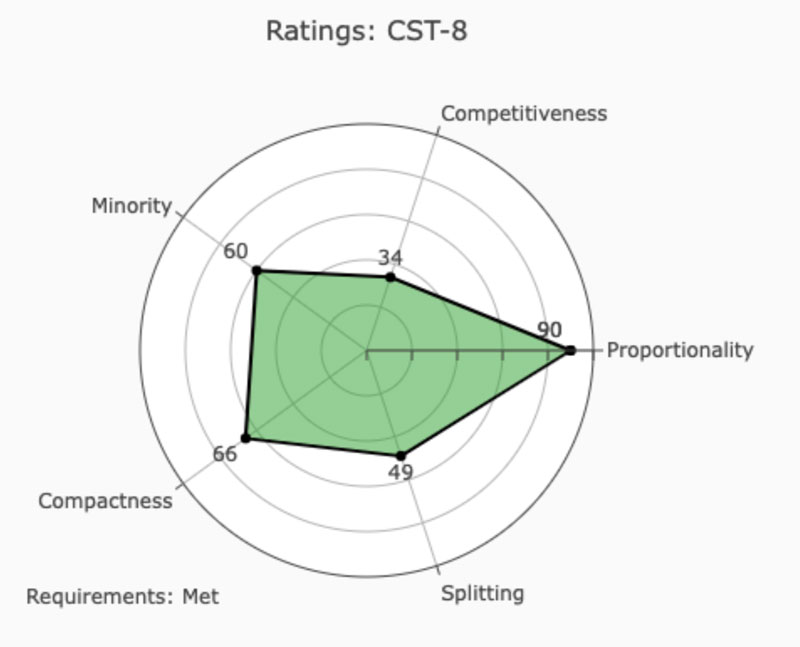
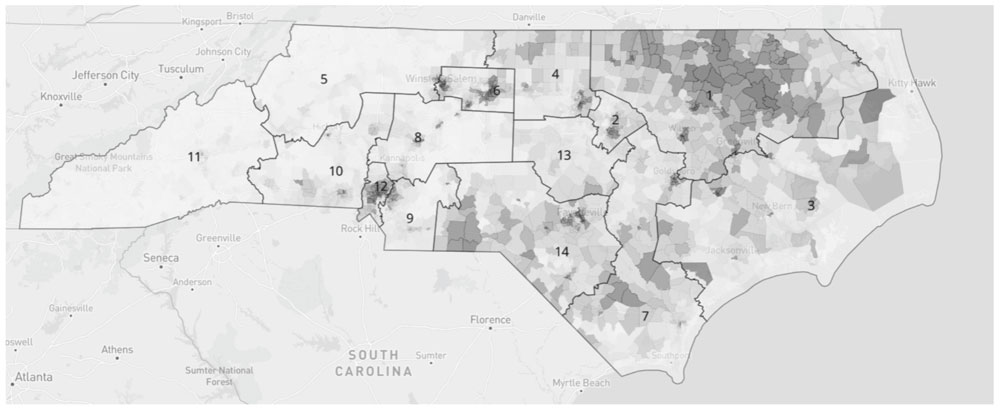
CST-8 Draft NC Congressional Map

The DRA Analysis shows:
- 6 districts are likely Republican
- Districts: 3, 5, 7, 8, 10, and 11
- 4 districts are likely Democratic
- Districts: 2, 4, 6, and 12
- 4 districts are competitive.
- Districts: 1, 9, 13 and 14
- There are 3 majority-minority districts.
- District 1, 12, and 14
DRA Analytics:
DRA 检查地图如何满足 5 个不同的标准: 比例, 竞争力, 少数族裔代表, 紧凑, 和 分裂。其每个类别的得分按 0-100 的等级列出如下。数字越高,得分越高。请注意,DRA 的少数族裔代表分析并不能确保遵守《投票权法案》(VRA)。DRA 还指出,利益共同体等某些因素可能难以量化。
Below is a view of the draft congressional map based on composite 2016-2020 election data 它综合了几次选举的结果。红色或蓝色越深,席位越安全。颜色越浅,席位越不安全。
To measure competitiveness, DRA uses the Democratic vote share. The rank votes graph below illustrates the democratic vote share in each district. Four of the districts had a Democratic vote share between 45% and 55% which DRA considers competitive. This includes districts 1, 9, 13, and 14. To learn more about how the rank votes graph works, 点击这里.
According to the DRA analysis, the most likely outcome of this map would be a 7-7 split. If Democrats won all the competitive districts, the result could be a 8-6 split in favor of the Democrats. If Republicans won all the competitive districts, the result could be a 10-4 split in favor of the Republicans.
这张地图显示了北卡罗来纳州黑人人口在各个地区的分布情况:

District 1 has a Black voting age population of 41.20%. It is the only district with a Black voting age population over 37%.
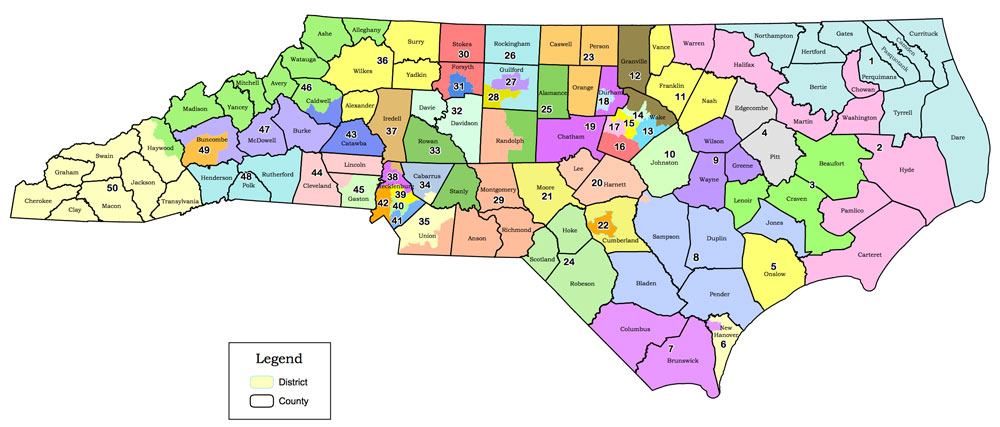
Draft NC Senate Maps
SST-13 Draft NC Senate Map (Drawn by Senate Redistricting Co-Chairs)
This map was amended from SCH-3 which was amended from SST-4. It has been included in the bill, SB 739.
According to the DRA Analysis:
- 24 districts are likely Republican
- 17 districts are likely Democratic
- 9 districts are competitive.
- There are 10 majority-minority districts.
DRA Analytics:
DRA 检查地图如何满足 5 个不同的标准: 比例, 竞争力, 少数族裔代表, 紧凑, 和 分裂. Its scores for each category are listed below on a 0-100 scale. A higher number indicates a better score. Note that DRA’s Minority Representation analysis does not ensure Voting Rights Act (VRA) compliance.

This view of the draft NC Senate map is based on composite 2016-2020 election data 它综合了几次选举的结果。红色或蓝色越深,席位越安全。颜色越浅,席位越不安全。

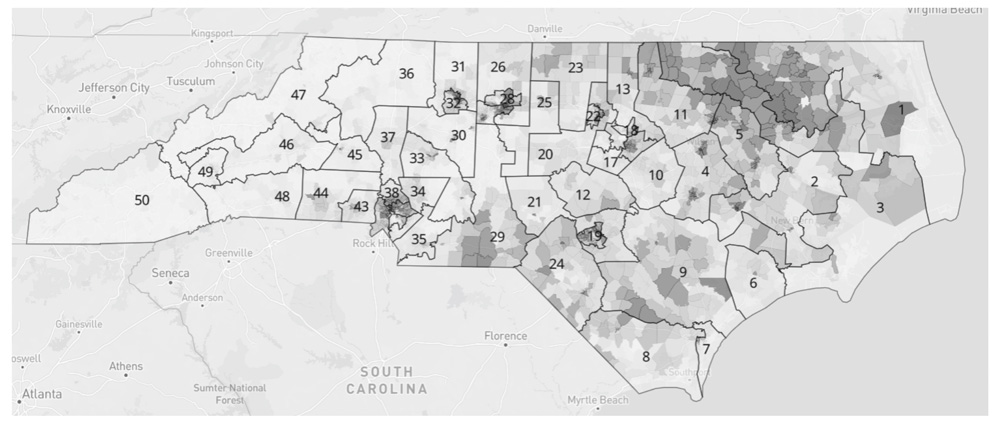
To measure competitiveness, Dave’s uses the Democratic vote share. Nine of these districts had a Democratic vote share between 45% and 55%. Out of those, 4 lean Democratic including district 41 (Southeast Mecklenburg), district 17 (Southern Wake), district 7 which includes Wilmington and Wrightsville Beach, and district 11 (Vance, Franklin, and Nash). The other 5 lean Republican including district 13 (Granville, and Northern Wake), district 24 (Hoke, Scotland, and Robeson), district 4 (Wayne, Wilson, Greene), district 2 (Warren, Halifax, Martin, Washington, Chowan, Hyde, Pamlico, Carteret), and district 1 (Northampton, Hertford, Bertie, Martin, Gates, Perquimans, Pasquotank, Camden, Currituck, Tyrell, Dare)
The rank votes graph below illustrates the Democratic vote share in each district. To learn more about how the rank votes graph works, 点击这里.
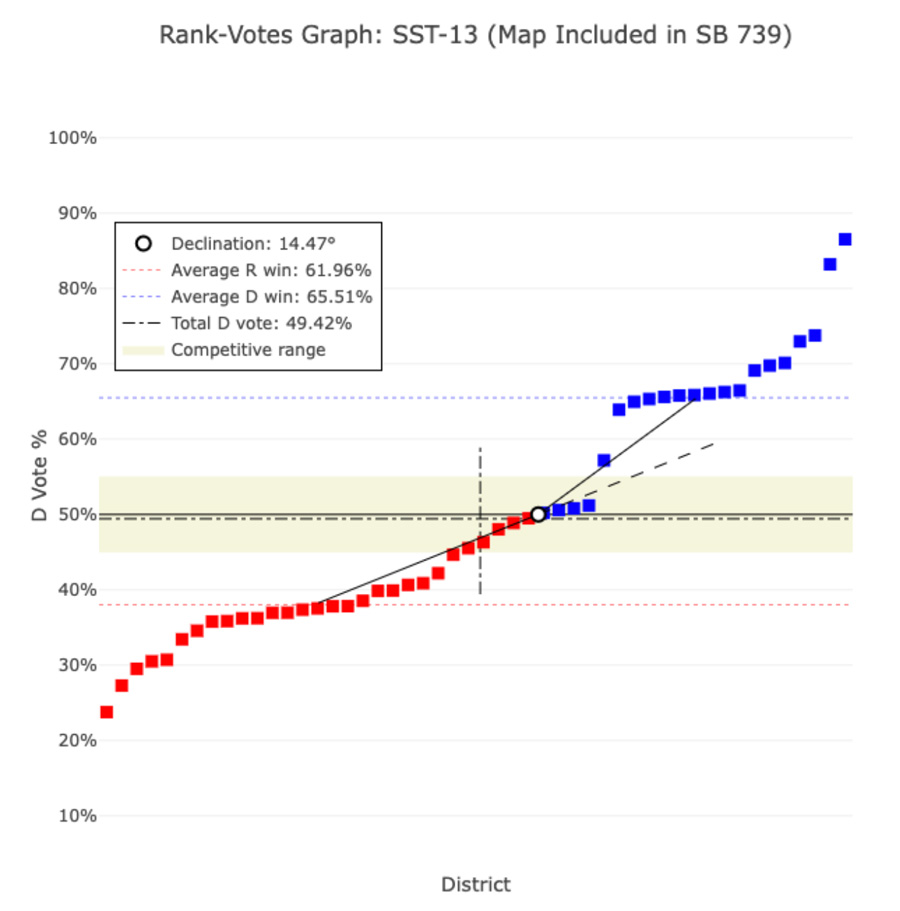
According to this analysis, this map would likely produce a 29-21 split in favor of the Republicans. Although, if all the competitive districts went for the Democrats, Democrats could gain a 26-24 majority. If all the competitive districts went for Republicans, they’d have a 33-17 majority.
This map shows how the Black population is spread out across the districts:

Eight of the districts have a Black voting age population of 37% or higher. Those are districts 5, 14, 19, 22, 27, 28, 39, and 40.
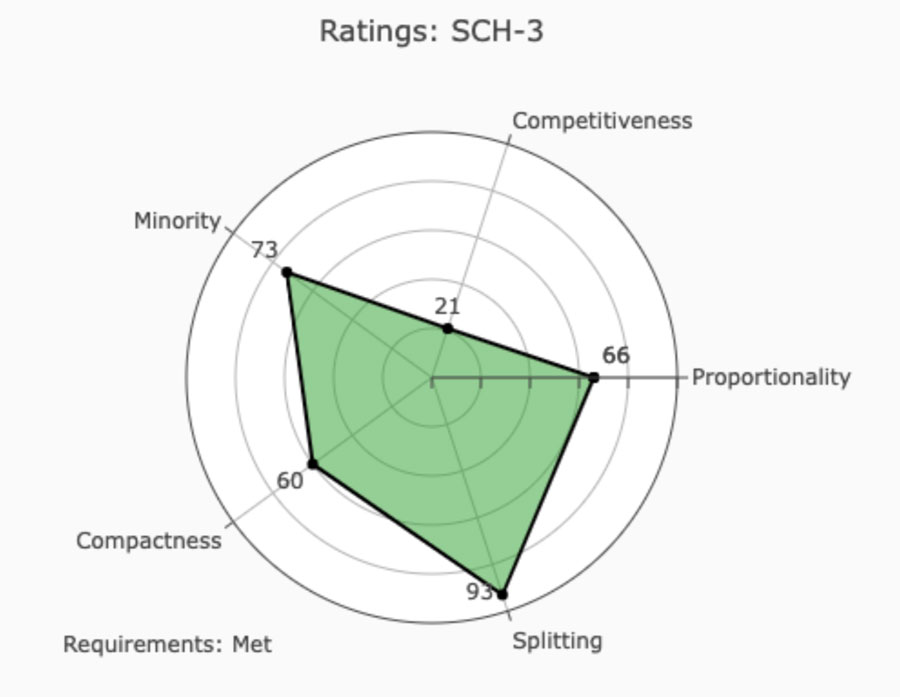
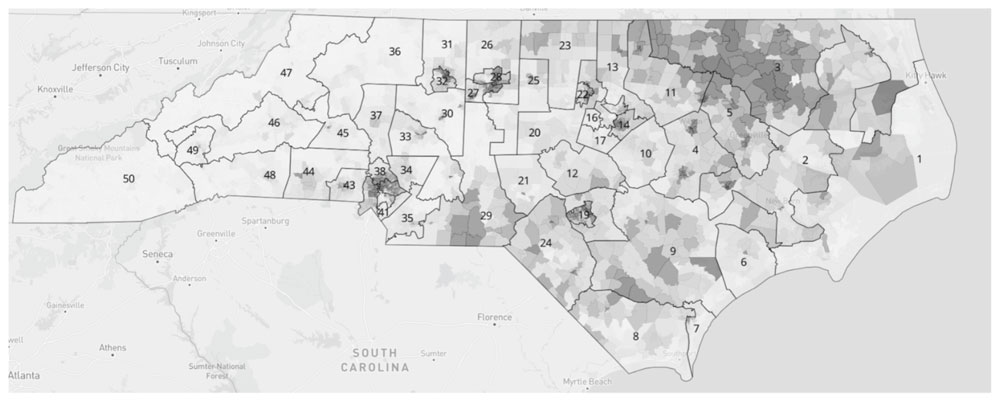
SCH-3 Draft NC Senate Map (Unofficial, DRA Trace, Drawn by Senate Redistricting Co-Chairs)
This map was amended from SST-4. It was drawn by the Senate redistricting co-chairs on October 27. It has not been posted to ncleg.gov.
According to the DRA Analysis:
- 25 districts are safe or likely Republican
- 17 districts are safe or likely Democratic
- 8 districts are competitive.
- There are 10 majority-minority districts.
DRA Analytics:
DRA 检查地图如何满足 5 个不同的标准: 比例, 竞争力, 少数族裔代表, 紧凑, 和 分裂. Its scores for each category are listed below on a 0-100 scale. A higher number indicates a better score. Note that DRA’s Minority Representation analysis does not ensure Voting Rights Act (VRA) compliance.
This view of the draft NC Senate map is based on composite 2016-2020 election data 它综合了几次选举的结果。红色或蓝色越深,席位越安全。颜色越浅,席位越不安全。
To measure competitiveness, Dave’s uses the Democratic vote share. Eight of these districts had a Democratic vote share between 45% and 55%. Out of those, 5 lean Democratic including district 41 (Southeast Mecklenburg), district 17 (Southern Wake), district 7 which includes Wilmington and Wrightsville Beach, district 11 (Vance, Franklin, and Nash), and district 3 (Warren, Halifax, Northampton, Martin, Bertie, Hertford, Gates, Camden, Currituck, and Tyrell). The other 3 lean Republican including district 13 (Granville, and Northern Wake), district 24 (Hoke, Scotland, and Robeson), and district 4 (Wayne, Wilson, Greene).
The rank votes graph below illustrates the Democratic vote share in each district. To learn more about how the rank votes graph works, 点击这里.
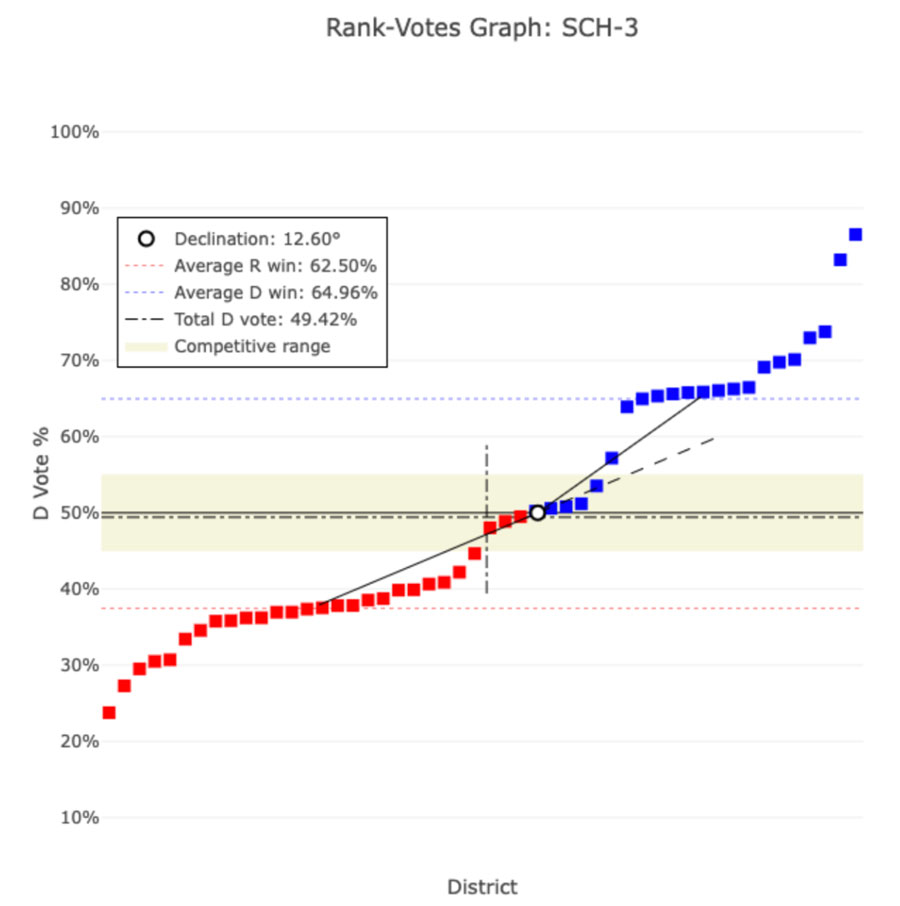
According to this analysis, this map would likely produce a 28-22 split in favor of the Republicans. Although, if all 8 competitive districts went for the Democrats, there could be a 25-25 tie. If all the competitive districts went for Republicans, they could have a 33-17 majority.
This map shows how the Black population is spread out across the districts:

Nine of the districts have a Black voting age population of 37% or higher. This includes districts 3, 5, 14, 19, 22, 27, 28, 39, and 40.
SST-4 Draft NC Senate Map (Drawn by Senate Redistricting Co-Chairs)
According to the DRA Analysis:
- 24 districts are safe or likely Republican
- 17 districts are safe or likely Democratic
- 9 districts are competitive.
- There are 10 majority-minority districts.
DRA Analytics:
DRA 检查地图如何满足 5 个不同的标准: 比例, 竞争力, 少数族裔代表, 紧凑, 和 分裂. Its scores for each category are listed below on a 0-100 scale. A higher number indicates a better score. Note that DRA’s Minority Representation analysis does not ensure Voting Rights Act (VRA) compliance.

This view of the draft Senate map is based on composite 2016-2020 election data 它综合了几次选举的结果。红色或蓝色越深,席位越安全。颜色越浅,席位越不安全。

To measure competitiveness, Dave’s uses the Democratic vote share. Nine of these districts had a Democratic vote share between 45% and 55%. Out of those, 4 lean Democratic including district 41 (Southeast Mecklenburg), district 16 (Southern Wake), district 6 which includes Wilmington and Wrightsville Beach and district 11 (Vance, Franklin, and Nash). The other 5 lean Republican including district 12 (Granville, and Northern Wake), district 2 (Warren, Halifax, Martin, Washington, Chowan, Hyde, Pamlico, Carteret), district 24 (Hoke, Scotland, and Robeson), district 9 (Wayne, Wilson, Greene), and district 1 (Northeast NC).
The rank votes graph below illustrates the democratic vote share in each district.
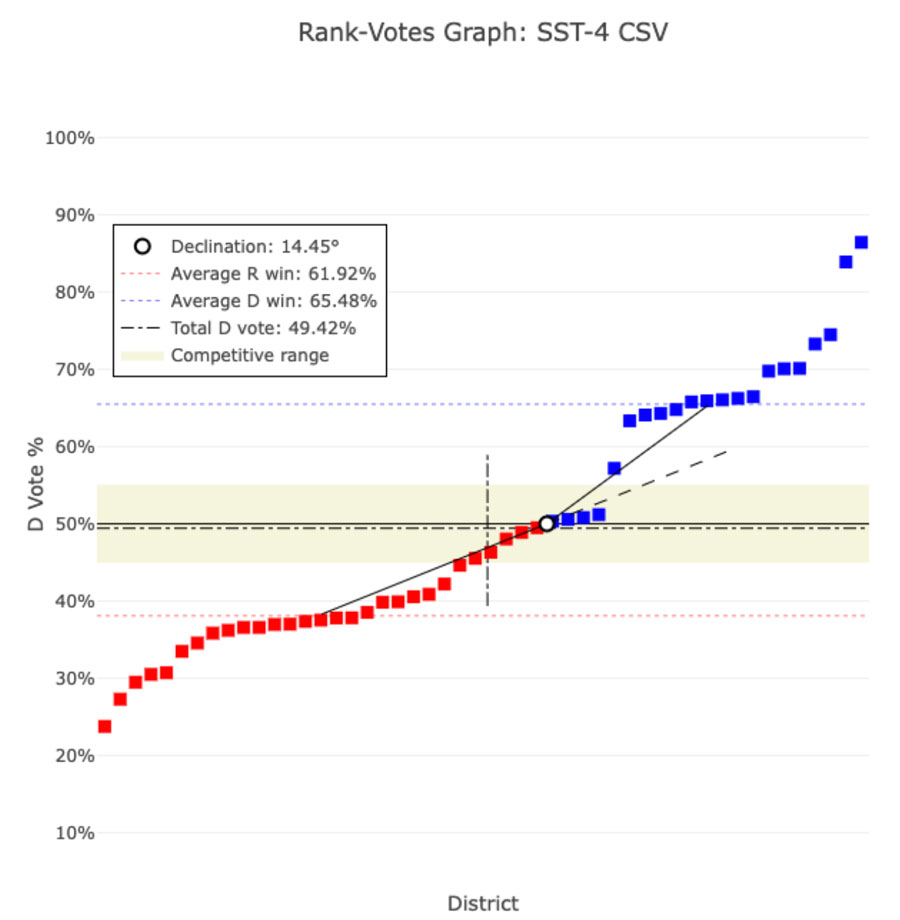
According to this analysis, it looks like this map would likely produce a 29-21 split in favor of the Republicans. Although, if all the competitive districts went for the Democrats, they could gain a 26-24 majority. If all the competitive districts went for Republicans, they’d have a 33-17 majority.
This map shows how the Black population is spread out across the districts:
Eight of the districts have a Black voting age population of 37% or higher. Those are districts 4, 13, 18, 22, 27, 28, 39, and 42. District 39 is the only district with a majority of the voting age population being Black (51.41%).
Draft NC House Maps
HBK-11 Draft NC House Map (Drawn by Rep. Destin Hall, chair of the House Redistricting Committee)

The DRA Analysis shows:
- 57 districts are likely Republican
- 40 districts are likely Democratic
- 23 districts are competitive.
- There are 29 majority-minority districts.
DRA Analytics:
DRA 检查地图如何满足 5 个不同的标准: 比例, 竞争力, 少数族裔代表, 紧凑, 和 分裂。其每个类别的得分按 0-100 的等级列出如下。数字越高,得分越高。请注意,DRA 的少数族裔代表分析并不能确保遵守《投票权法案》(VRA)。DRA 还指出,利益共同体等某些因素可能难以量化。
Below is a view of the draft NC House map based on composite 2016-2020 election data 它综合了几次选举的结果。红色或蓝色越深,席位越安全。颜色越浅,席位越不安全。

To measure competitiveness, DRA uses the Democratic vote share. The rank votes graph below illustrates the democratic vote share in each district. 23 of the districts had a Democratic vote share between 45% and 55% which DRA considers competitive. To learn more about how the rank votes graph works, 点击这里.

Out of the 23 competitive districts, 12 lean Republican and 11 lean Democratic. According to the DRA analysis, the most likely outcome of this map would be a 69-51 split in favor of the Republicans. If Democrats won all the competitive districts, the result could be a 63-57 split in favor of the Democrats. If Republicans won all the competitive districts, the result could be a 80-40 split in favor of the Republicans.
这张地图显示了北卡罗来纳州黑人人口在各个地区的分布情况:
There are 25 districts with a Black voting age population over 37%. In 3 of the districts, the majority of the voting age population is Black. This includes district 5 (Edgecombe, Martin, Bertie), district 13 (Warren, Halifax, Northampton), and district 27 (West Fayetteville).
In order to further public transparency this redistricting cycle and allow for public review of potential draft maps that will be up for consideration, Common Cause has uploaded the member-submitted maps posted on the NCleg.gov website into Dave’s Redistricting Application (DRA). This information is provided for public education only, and the analysis here reflects that generated by the DRA program and does not constitute an opinion on or endorsement of these maps by Common Cause.